Operations | Monitoring | ITSM | DevOps | Cloud

Icinga Camp Berlin 2022: Current State of Icinga DB by Eric Lippmann

In recent years, the number of servers, virtual machines, services, applications, etc. that our customers and users monitor with Icinga has increased significantly. For very large environments, the IDO can be a performance bottleneck. With Icinga DB we’ve rethought everything to allow users to monitor massive amounts of data and bring exclusive features that weren’t possible before.


Icinga Camp Berlin 2022: Blerim Sheqa How Companies use Icinga by Blerim Sheqa

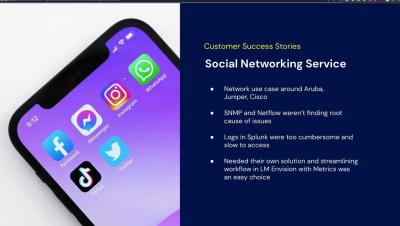
During the past months we’ve been in direct contact with enterprises to understand their Icinga story. As result we created multiple customer stories which differ in their use case. I want to exemplify how Icinga meets different requirements of organizations and helps them cover their monitoring demands.

Why it's important to upgrade your Mattermost Server

Upgrading your Mattermost server involves a bit of research, preparation, and downtime. The pressure to keep your Mattermost instance healthy and reduce downtime for a core system within your organization can be intimidating. Recently, we worked with a handful of customers who were experiencing issues upgrading from Mattermost v5.37 and v5.39 to v6.x. Unfortunately, migration scripts were required to make significant database changes, and there was an issue in product performance.

Making Sure the Future of Federal Work Is Secure and Enjoyable - Why We're Partnering with NIST on Its Zero Trust Project

Last year, we announced our partnership with the National Cybersecurity Center of Excellence (NCCoE) at the National Institute of Standards and Technology (NIST) to work on the Implementing a Zero Trust Architecture project. After a year of collaboration with its industry partners, including Ivanti, NIST recently released its preliminary draft, NIST Cybersecurity Practice Guide SP 1800-35 Vol B, for public comment.

How to Overcome Datadog Log Management Challenges

Datadog has made a name for itself as a popular cloud-native application performance monitoring tool, measuring a system’s health and status based on the telemetry data it generates. This telemetry includes machine-generated data, such as logs, metrics and traces. Cloud based applications and infrastructure generate millions (even billions) of logs – and analyzing them can generate a wealth of insights for DevOps, security, product teams and more.

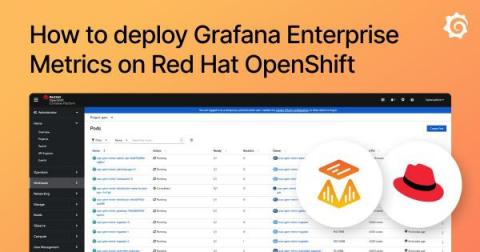
How to deploy Grafana Enterprise Metrics on Red Hat OpenShift

Here at Grafana Labs, we’re always looking for ways to provide our customers with a choice of platforms where they can run Grafana Enterprise Metrics (GEM). As part of that mission, we’re pleased to announce that we’ve added Red Hat OpenShift 4.x support to GEM. GEM, as you may know, is a leading enterprise metrics solution.

Code signing: securing against supply chain vulnerabilities

When creating an application, developers often rely on many different tools, programs, and people. This collection of agents and actors involved in the software development lifecycle (SDLC) is called the software supply chain. The software supply chain refers to anything that touches or influences applications during development, production, and deployment — including developers, dependencies, network interfaces, and DevOps practices.