Tutorial: How to connect Checkmk to SIGNL4
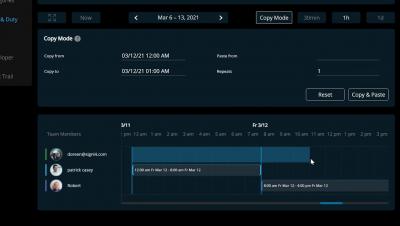
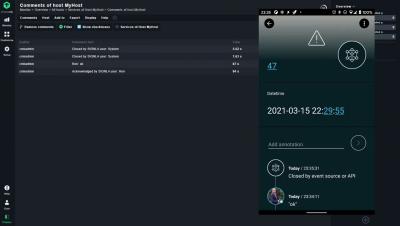
How to add critical mobile alerting to Checkmk with SIGNL4. Ronald explains how to implement a 2-way integration of SIGNL4 with Checkmk. A SIGNL4 connector is now a part of Checkmk 2.0


In this article, we are going to look at the architecture of Apache ActiveMQ and how to monitor critical metrics of ActiveMQ using Hosted Prometheus and Hosted Grafana. If you would like to follow the steps in this blog, make sure to sign up for the MetricFire free trial. You can use Graphite and Grafana directly from our platform. MetricFire is a Hosted Graphite, Grafana and Prometheus service, where we do the setup and management of these open-source tools so you don’t have to.
Today, Logz.io is thrilled to announce that Prometheus-as-a-service is now generally available for anyone to try themselves! I’d like to thank the Logz.io village for executing a huge milestone on our quest to unify the best open source monitoring tools on Logz.io’s scalable cloud platform.
Like many companies, we have a Hack Week at Sentry. In 2017, we coded an app which blared entrance music for anyone who stepped foot in our office. In 2019, we encouraged folks to be nice on the Internet. Noble causes, sure, but for this year’s Hack Week I was determined to advance a cause near and dear to my cold British heart: dark mode.
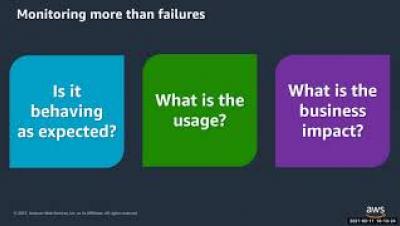
To prevent failure and minimize downtime, it’s important to make sure your infrastructure and applications are observable. But, just getting to the point of observability isn’t enough. You need to be able to use the data that comes with observability — ideally in a way that helps your team troubleshoot more quickly and minimize or prevent downtime.