Operations | Monitoring | ITSM | DevOps | Cloud

Latest Posts

Using context to triage change-triggered incidents

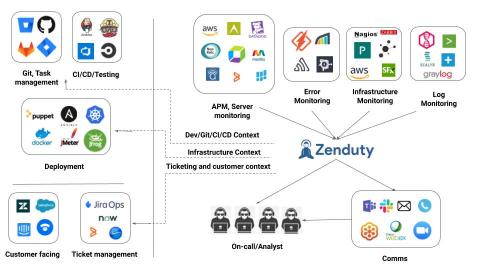
One of the first things incident managers do when they get an alert page from Zenduty is to check the “Context” tab of the incident. Incident context is extremely critical to get a first responder’s view of what happened and what could possibly have caused it. Context tells you what happened before an incident. In the case of 40–50% of all incidents, Zenduty’s incident context can tell you within 5–10 seconds, what could be the cause of an incident.

Easy automated E2E testing & monitoring for your frontend with Vercel and Checkly

Exciting times ahead. With the Jamstack gaining momentum, the landscape around it is offering more and more tools to streamline developer workflows and free up time for actual development. A cutting edge solution in this interesting space is Vercel, formerly known as ZEIT. In this blog post we will get a taste of Vercel's capabilities by using it to deploy and preview a sample Gatsby blog - and while we're at it, we will of course take the chance to kick off some checks automatically from Checkly.

Embrace Growing and Untapped Data Sources Without Price as a Limitation

At Splunk, we're listening to our customers and offering more predictable, flexible, and familiar pricing options as part of our Data-to-Everything Pricing model. In particular, Splunk’s new infrastructure pricing metric changes the paradigm of how much data you can analyze with Splunk, allowing users to move toward a value-driven pricing model that better aligns what you pay with real value you can extract from using Splunk products.

Identifying and monitoring key metrics for your hosts and systems

This post is the first in a three-part series on how to effectively monitor the hosts and systems in your ecosystem, and we're starting with the one you use most: your personal computer. Metrics are a key part of observability, providing insight into the usage of your systems, allowing you to optimize for efficiency and plan for growth. Let's take a look at the different metrics you should be monitoring.

How to Add Incident Alert Management to Your DevOps Pipeline

DevOps pipelines enable teams to implement continuous software development processes, often by using automation and collaboration tooling. The overall goal is to quickly release software products, updates, and fixes. To ensure a DevOps pipeline works well, teams add management and monitoring tooling to the pipeline. This includes incident alert management, which supports the team’s efforts in monitoring the security of various software and environment components.

NoSQL-based stacks exposed to the Internet

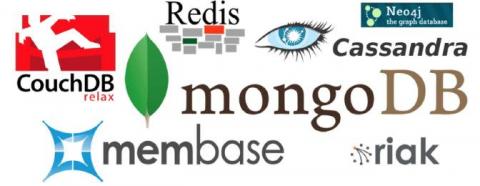
NoSQL technology has become more popular in recent years thanks to the development of new open-source NoSQL databases that are relatively easy to install, use and integrate with web frameworks. An example of one of those popular frameworks on the internet is known as MEAN (MongoDb, Express.js, Angular.js, Node.js). These NoSQL frameworks have become very popular for things such as content management, catalogs and big data in general.

How Multi-Tenant Repositories Benefit Workflows

Software Engineering is hard. As time has progressed, the number of languages, frameworks and packages available has grown to the point where it’s rare nowadays to find a project that is developed entirely in a single language or within a single ecosystem. A typical project uses the best languages and frameworks for the job, and these frequently differ depending on what part of the project is being developed.

Hybrid cloud and multi-cloud: what is the difference?

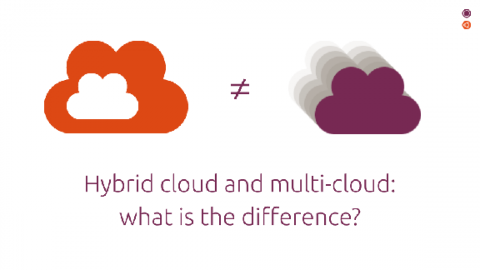
Hybrid cloud and multi-cloud are two exclusive terms that are often confused. While the hybrid cloud represents a model for extending private cloud infrastructure with one of the existing public clouds, a multi-cloud refers to an environment where multiple clouds are used at the same time, regardless of their type. Thus, while the hybrid cloud represents a very specific use case, multi-cloud is a more generic term and usually better reflects reality.

Ubuntu on WSL 2 Is Generally Available

Today Microsoft announced the general availability of Windows Subsystem for Linux 2 in the Windows 10 May 2020 update. WSL 2 is based on a new architecture that provides full Linux binary application compatibility and improved performance. WSL 2 is powered by a real Linux kernel in a lightweight virtual machine that boots in under two seconds. WSL 2 is the best way to experience Ubuntu on WSL.

Splunk - Creates real-time business impact from data

From dealing with security concerns to production monitoring, businesses need to analyze the log data of their systems to ensure everything is functioning normally. In a computing context, a log refers to automatically produced and time-stamped documentation of events related to a particular system. Analysis of log data helps businesses comply with regulations, security policies and audits, understand online consumer behavior, and comprehend system troubleshoots.