Operations | Monitoring | ITSM | DevOps | Cloud
Blog
5 Professional Tools for Prototyping your New UX Project
It is probably the best time to be a designer right now since there are many online tools and software that targets designing pain points and simplifies them. From the creation of an idea down to its realization; designers can find appropriate tools that will help them in drawing out their thoughts, figuring out the complexities, and finding out how the users interact with their designs.
Intro to RBAC in Sensu Go
Last month, we ran a webinar on role-based access control (RBAC) in Sensu Go. In this post, we’ll capture some of the key points from the presentation and show you how RBAC can help you lock down access for increased security and team efficiency.
Key metrics for monitoring Istio
Istio is an open source service mesh that was released in 2017 as a joint project from Google, IBM, and Lyft. By abstracting the network routes between services from your application logic, Istio allows you to manage your network architecture without altering your application code. Istio makes it easier to implement canary deployments, circuit breakers, load balancing, and other architectural changes, while also offering service discovery, built-in telemetry, and transport layer security.
Istio monitoring tools
In Part 1, we showed you the metrics that can give you visibility into your Istio service mesh and Istio’s internal components. Observability is baked into Istio’s design—Mixer extracts attributes from traffic through the mesh, and uses these to collect the mesh-based metrics we introduced in Part 1. On top of that, each Istio component exposes metrics for its own internal workings.
How to monitor Istio with Datadog
In Part 2, we showed you how to use Istio’s built-in features and integrations with third-party tools to visualize your service mesh, including the metrics that we introduced in Part 1. While Istio’s containerized architecture makes it straightforward to plug in different kinds of visualization software like Kiali and Grafana, you can get deeper visibility into your service mesh and reduce the time you spend troubleshooting by monitoring Istio with a single platform.
Reinventing Hybrid Monitoring with AI and Automation
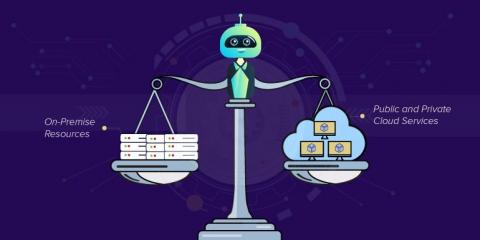
Adoption of hybrid cloud-public cloud services with on-premises resources, is gaining prominence among SMBs and large enterprises alike. This is principally because organizations can still maintain some elements of their enterprise on-premises while running other applications, like the e-commerce front-end in the cloud.
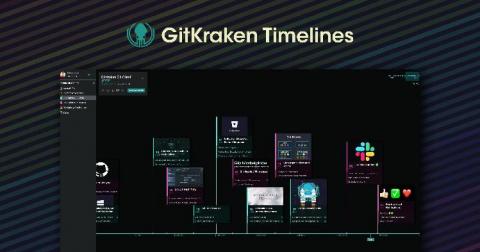
Introducing GitKraken Timelines
Whether you’re a product owner, project manager, or the CEO of the company, understanding how your team plans for and achieves project milestones is crucial to reaching long-term and sustainable success.
Lock-free Observations for Prometheus Histograms
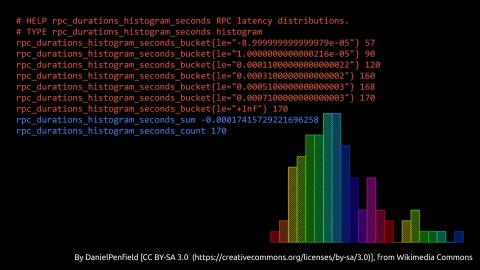
There’s a famous Go proverb that states: Don’t communicate by sharing memory; share memory by communicating. At GopherCon UK 2019, Björn Rabenstein, an engineer at Grafana and a Prometheus developer, told the audience that when it comes to observations for Prometheus histograms, that saying doesn’t hold true.


