Operations | Monitoring | ITSM | DevOps | Cloud

APM

The latest News and Information on Application Performance Monitoring and related technologies.

Microsoft Teams on Citrix: Configuration and Deployment

Since early 2020, there has been a massive growth in the number of active Microsoft Teams users and organizations deploying Teams; now, there are more than 200 million monthly active users across the globe. With an increase in market share, it’s one of those applications that you either expect an organization to be already using or planning to deploy out to their environment sooner rather than later.

What is APM? Overview and Features (The Beginner's Guide)

Application performance monitoring (APM) extends observability beyond system availability, service performance, and response times in current, cloud-native contexts. Organizations can improve user experiences at the scale of modern computing by using automatic and intelligent observability. User experiences in software applications are monitored and managed using APM technologies.

Troubleshoot Javascript (in real-time)

Javascript execution analysis on dev environments is easy—just use Google Developer or some other free tools. However, getting the same level of analysis while your application is being used by a real user is much harder. You can’t possibly ask the end-user to help you troubleshoot. Even if you did, the user probably wouldn’t know what to do and they definitely wouldn’t be impressed by your organization.

Product Growth KPIs Dashboard for Enterprises

There can be as many as 64 important business metrics for your company to track (according to nTask). That can sound daunting. But if your organization doesn’t have the capacity to track all of them, it should at least track the most important ones according to its business model, stage and focus areas. For example, key product metrics not only provide information to product managers, but also other relevant stakeholders across the organization.

This Month in Datadog: November 2021 (Episode 6)

Datadog is constantly elevating the approach to cloud monitoring and security. This Month in Datadog updates you on our newest product features, announcements, resources, and events. This month we put the Spotlight on Network Device Monitoring, along with highlighting the many announcements and guest presentations from Dash.

Monitoring Elastic Enterprise Search performance using Elastic APM

Elastic APM is a free, open and powerful observability tool that provides intelligence into application performance for a myriad of production applications (e.g., throughput, error rates, latency, resource usage, transaction traces). You can now enable Elastic APM integration to gain deep insight into the performance behaviors of your Elastic Enterprise Search deployment!

Four powerful Alerting workflows

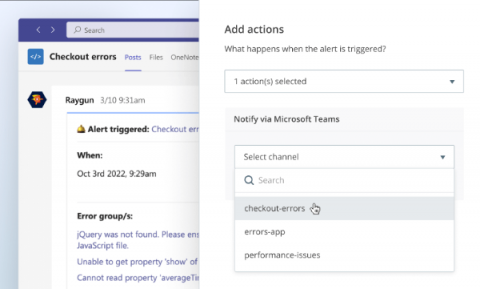
Since its release last month, Alerting has quickly ingrained itself into the incident response workflow at some of the most technically advanced companies in the world. We’re here to empower your team to do the same. In this blog, we’ll run through four common alerts that you can implement today to ensure you’re maximizing the full potential of Alerting.

Datadog vs. Dynatrace vs. Scout

Application Performance Monitoring is undoubtedly the hottest tool to accelerate any product’s growth in the modern market. The term has grown from a simple performance tracking operation to full-fledged infrastructure, network, and application observability. This evolution has only helped bring more and more growth into products. It is essential to choose the best-suited monitoring solution for your apps since observability involves way too many moving pieces.