Operations | Monitoring | ITSM | DevOps | Cloud

When Peak Business Demand Depends on Information Nobody Sees

Modern enterprises no longer operate as isolated systems. Every customer order, supplier commitment, shipment, invoice, and payment relies on information moving seamlessly across a growing network of applications, partners, and business functions. In many SAP-driven organizations, SAP IDocs serve as one of the primary mechanisms for exchanging business information between various SAP and non-SAP systems. Most business users never see them, never interact with them, and often never hear about them.
Best Practices for Effective Healthcare Networks

An effective healthcare network is the IT infrastructure that keeps clinical and operational services reachable, responsive and diagnosable across hospitals, clinics, imaging centers, laboratories, remote sites, cloud services and vendor connections. A device can be up while Electronic Health Record (EHR) access, Picture Archiving and Communication System (PACS) retrieval, telehealth or a wireless clinical workflow is still slow or unavailable.

Introducing Selector Foundry: Agentic NetOps

Network operations teams have heard plenty about AI this year. Most of it answers the alert in front of it, then hands the rest of the incident back to an engineer. Someone still has to correlate the evidence, find the cause, prepare the fix, and prove it held. This week, we announced Selector Foundry, the agentic NetOps solution built into the Selector platform. Foundry adds a team of specialized AI agents on top of the full-stack observability and AIOps foundation our customers already run.

From SOCI Compliance to Continuous Infrastructure: How Puppet Helps Protect Critical Infrastructure

Australia’s critical infrastructure landscape has changed significantly. The Security of Critical Infrastructure Act 2018 (SOCI Act) has evolved from a framework focused primarily on identifying critical assets and reporting incidents into a broader risk-management and operational-resilience regime. The 2024 reforms reinforced that direction, increasing the focus on the systems, data, and technology dependencies that underpin Australia’s essential services.

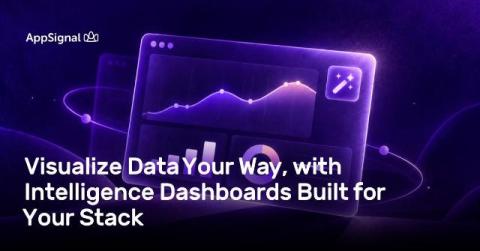
Visualize Data Your Way, with Intelligence Dashboards Built for Your Stack

When something goes wrong in production, you do not want to spend the first five minutes rearranging charts. You want the error rate, throughput, queue depth, memory, and view metrics that show when customers are having issues while using your app.

What if your agent's hallucinations had a budget? How to start using SLOs for agent behavior

At Grafana Labs, observability is what we do. So as we started building AI agents, we naturally reached for the same instincts we bring to every system: measure it, set targets, and make reliability something you can reason about instead of hope for. That instinct led us somewhere unexpectedly useful. It turns out one of the oldest ideas in reliability engineering, the error budget, maps beautifully onto one of the newest problems in software: how do you know if an AI agent is actually any good?

You made coding faster. Guess where the bottleneck went next.

Somewhere in the last year, your team's code output went up. Pull requests are opened faster. The backlog of small fixes and routine changes started clearing quicker than it used to. If delivery still feels roughly as slow as it did before, that's what happens when you speed up one part of a process without touching anything downstream of it.

We stopped asking an LLM how much its own work would cost

There’s a specific kind of measurement problem worth naming precisely rather than dramatizing: this month we found that our model-routing agent was assigning a token budget to every unit of work, and that budget was noise in the strict sense. Fixing it meant improving a system that’s mostly right, not tearing one down.