Operations | Monitoring | ITSM | DevOps | Cloud

What are web checks and ping checks? Why are they important?

Keeping your websites and web-based applications running smoothly for your users is essential. External users that can’t get onto your client-facing portals will quickly turn to competitors. Internal users having difficulty with your network will become frustrated which can reduce morale and productivity. Network monitoring via web checks and ping checks could improve website uptime and make everyone’s lives a little easier.


Monitoring Machine Learning

I used to think my job as a developer was done once I trained and deployed the machine learning model. Little did I know that deployment is only the first step! Making sure my tech baby is doing fine in the real world is equally important. Fortunately, this can be done with machine learning monitoring. In this article, we’ll discuss what can go wrong with our machine-learning model after deployment and how to keep it in check.

Introducing the Datadog Open Source Hub

At Datadog, we have always been deeply involved with open source software—producing it, using it, and contributing to it. Our Agent, tracers, SDKs, and libraries have been open source from the beginning, giving our customers the flexibility to extend our tools for their own needs. The transparency of our open source components also allows them to fully audit the Datadog software that is running on their systems. But our commitment to open source only starts there.

Pick 3 for Your Data Management: Speed, Choice, and Flexibility

Data growth has significantly out-pacing budgets; the products we use, have to do more. This is where optimization comes into play. Generally, optimization is associated with reduction which may be intimidating…what if something important is reduced? How can you identify what should be reduced? Reduction isn’t about removing context, but about removing repetitive data, meaningless fields, or even flattening JSON.

Sumo Logic ahead of the pack in a consolidating market

The observability and cybersecurity sector is chock full of providers from startups like StateStack and Coralogix to established organizations like Datadog, Sumo Logic and Splunk, offering solutions with capabilities of various depth and breadth that are solving the tough problems of application reliability and security.

The Evolution of Data Center Networking for AI Workloads

Traditional data center networking can’t meet the needs of today’s AI workload communication. We need a different networking paradigm to meet these new challenges. In this blog post, learn about the technical changes happening in data center networking from the silicon to the hardware to the cables in between.

Observability at Scale Needs Summary

The shift from traditional monitoring to observability is widespread, and necessary. It's the way we make sense of increasingly complex and distributed systems. But when we capture all this data at scale... what do we do with it all? If this data itself had inherent value, we’d all be rich. But in the real world data does not provide us value until we can act on what it tells us.

Introducing the Prometheus Java client 1.0.0

PromCon, the annual Prometheus community conference, is around the corner, and this year I’ll have exciting news to share from the Prometheus Java community: The highly anticipated 1.0.0 version of the Prometheus Java client library is here! At Grafana Labs, we’re big proponents of Prometheus. And as a maintainer of the Prometheus Java client library, I highly appreciate the support, as it helps us to drive innovation in the Prometheus community.

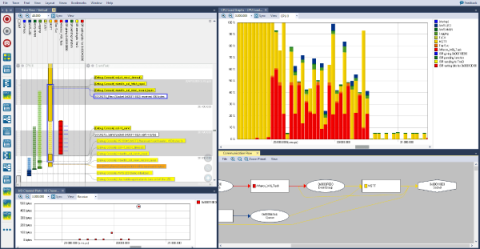
Introducing Tracealyzer SDK for Custom Integrations

Percepio Tracealyzer is available for many popular real-time operating systems (RTOS), including FreeRTOS, Zephyr, and Azure RTOS ThreadX, and also for Linux. But what if you want to use it for another RTOS, one that Percepio doesn’t provide an integration for? Then you’ve been out of luck—until now.