Operations | Monitoring | ITSM | DevOps | Cloud

Why the visibility gap is holding your IT operations back

Depending on your business, MTTR stands for mean time to repair or mean time to recovery – but it can also mean resolution, resolve, or restore. No matter how you define it, the basic measurement is the same: it’s the time it takes from when something goes down to when it is back and fully functional. This includes everything from finding the problem to fixing it. For ITOps teams, keeping MTTR to an absolute minimum is crucial.
Log Management in the Age of Observability

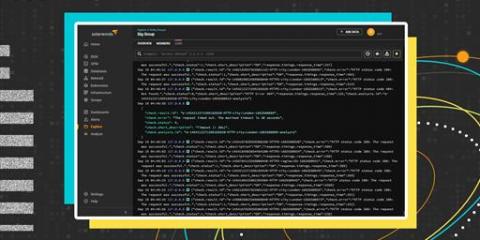
The explosive growth of interconnected data across distributed systems has disrupted traditional development, DevOps, and ITOps practices and forced many organizations to rethink their cloud strategies. Higher-velocity feature development and more responsive support requests involve developers throughout the delivery cycle and require them to monitor and observe application behavior before releasing it to production.

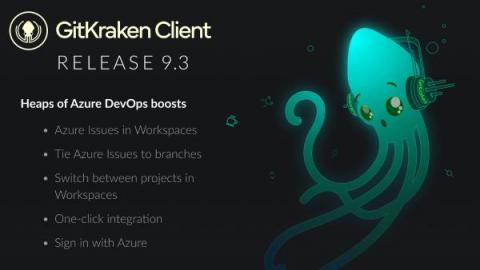
GitKraken Client 9.3: Skip the Corporate UI and Stay in That Sweet GitKraken Dark Theme

This release is all about improving our Azure DevOps integration. According to our super sea-cret metrics, Azure DevOps is our users’ third most popular Git hosting service, after GitHub and Bitbucket. That explains why so many of you have sent in support tickets or submitted feature requests to make the integration with Azure match the excellent experience users have with our Bitbucket, GitHub, and GitLab integrations.

Real User Monitoring (RUM) vs. Synthetic Monitoring

Real User Monitoring (RAM) and Synthetic Monitoring are two different approaches to website and application monitoring. They both serve the same purpose of ensuring optimal performance of a website or application, but they differ in how they collect data and the types of insights they provide. Understanding the difference between the two can help you determine which approach is best suited for your specific needs.

How to collect and query Kubernetes logs with Grafana Loki, Grafana, and Grafana Agent

Logging in Kubernetes can help you track the health of your cluster and its applications. Logs can be used to identify and debug any issues that occur. Logging can also be used to gain insights into application and system performance. Moreover, collecting and analyzing application and cluster logs can help identify bottlenecks and optimize your deployment for better performance.

Patch Windows Common Log File System Driver Vulnerability (CVE-2023-23376)

As the digital world becomes more interconnected, cyber threats evolve and become more sophisticated, putting businesses and individuals at risk. On February 14, 2023, Microsoft announced a critical vulnerability in the Windows Common Log File System (CLFS) driver, known as CVE-2023-23376. This vulnerability allows attackers to elevate privileges and gain unauthorized access to sensitive data, potentially resulting in severe consequences for affected systems.

Syntax × Sentry MMXXIII

Today is a special day at Sentry, as today we welcome Syntax to the family. We’ve long been fans of Scott and Wes, of what they’ve built with Syntax, and of their general curiosity, drive, and hustle. As one of Sentry’s earliest partners, it’s been amazing to watch and experience their growth alongside our own. Today we’re going to talk about the next chapter of Syntax, one with increasing ambition, and one we hope you’ll be just as excited about as we are.

Distributed Tracing for AWS CDK Applications

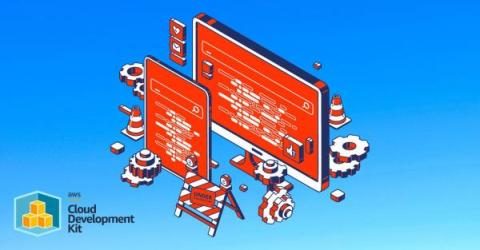
The AWS CDK lets users build as Infrastructure as Code (IaC) reliable, scalable, and cost-effective applications in their cloud environments. With the AWS CDK, developers can use various supported programming languages to create constructs (reusable cloud components) and compose them together into stacks and applications.