Operations | Monitoring | ITSM | DevOps | Cloud

Monitoring

The latest News and Information on Monitoring for Websites, Applications, APIs, Infrastructure, and other technologies.

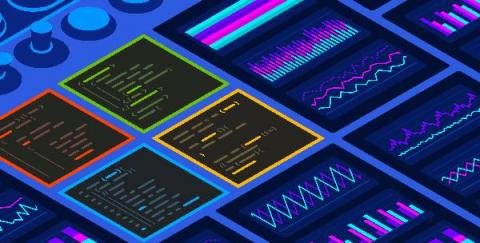
Visualize your DevOps data for free

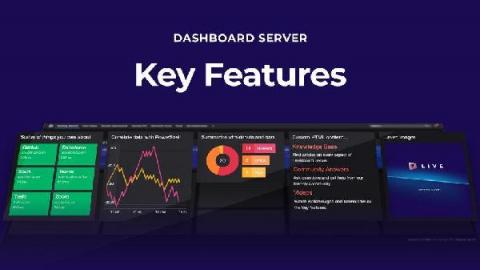
We recently launched the public preview of a new tool that lets anyone dashboard anything – for free. Meet Dashboard Server! You can download it free because we wanted to get our incredible dashboards in the hands of more people. The SCOM community know us well but our dashboards are perfect for so many use cases beyond System Center monitoring. And if you love them as much as we think you will, all we ask in return is that you share that love by spreading the word.

Logz.io Infrastructure Monitoring: Building Visualizations in Dashboards

In a previous post I explained how to send metrics to Logz.io Infrastructure monitoring with Prometheus—now let’s analyze them by building Prometheus dashboards and visualizations in our metrics UI! Once you’ve started to send metric data to Logz.io, how do you visualize and interpret that data so that it’s useful for you? Logz.io Infrastructure Monitoring provides powerful querying and visualization of your data.

VirtualMetric Webinar Cloud Native Applications on VMware & Kubernetes

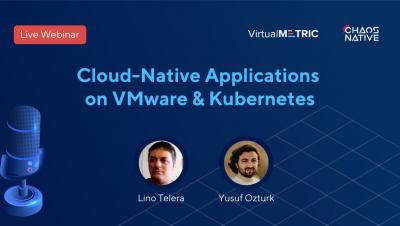
In this webinar, Yusuf Ozturk hosted Lino Telera to speak about Cloud-Native Applications on VMware & Kubernetes. You will learn about Kubernetes, the ways to deploy it, get CI/CD Pipeline example and even see a Live Demo. Speaker: Lino Telera, Cloud Architect at InfoCert S.p.A and Blogger at blog.linoproject.net, Cloud-Native Coach, 7 x vExpert and VMUG leader. What does it mean to build and deploy Cloud-Native Application today? Introduction to Kubernetes.

Monitoring Windows Event Logs - Getting Started

Windows event logs are important for security, troubleshooting, and compliance. When you analyze your logs, you can monitor and report on file access, network connections, unauthorized activity, error messages, and unusual network and system behavior. However, Windows servers produce tens of thousands of log entries every day.

Secure by Design | Securing the Software Development Build Environment

The recent SUNBURST cyberattack on the SolarWinds software build environment is a concerning new reality for the software industry, representing the increasingly sophisticated actions by outside nation-states on the supply chains and infrastructure on which we all rely. SolarWinds is committed to sharing our learnings about this attack broadly given the common development practices in the industry and our belief that transparency and cooperation are our best tools to help prevent and protect against future attacks.

The Relationship Between Observability vs. Monitoring

Monitoring has always been a crucial operation in a software development cycle. This is mainly because of the complexity of industry-level IT and consumer-facing product development. Additionally, there is an ever-growing demand for rapid upgrades in products. To meet these requirements, streamlined performance and stability have become more important than ever; and without effective monitoring practices, they appear difficult to achieve.

Business Service Monitoring (BSM) with GroundWork Monitor

We all want our monitoring systems to alert us when things go wrong. While it’s important to get alerts in the event of a failure or latency problem on something specific such as a SQL database, it’s actually just as important to not receive alerts from too many specific sources in the same alerting channel. If our monitoring system starts to fatigue us, we will ignore alerts until the phone calls and Emails from end users start letting us know a service is impaired or unavailable.

How to Understand Log Levels

More than once, I’ve heard experienced software developers say that there are only two reasons to log: either you log Information or you log an Error. The implication here is that either you want to record something that happened or you want to be able to react to something that went wrong. In this article, we’ll take a closer look at logging and explore the fact that log levels are more than just black or red rows in your main logging system.

Monitor .NET runtime metrics with Datadog

If you are a .NET developer, monitoring runtime metrics can help you troubleshoot bugs and detect resource inefficiencies in your applications. With Datadog, you can easily collect, visualize, and alert on key .NET runtime metrics, including exceptions, garbage collection statistics, thread count, and more. We have fully integrated .NET runtime metrics into Datadog APM so that you can easily view them alongside your distributed traces, logs, and other telemetry.