Auto-smooth noisy metrics to reveal trends
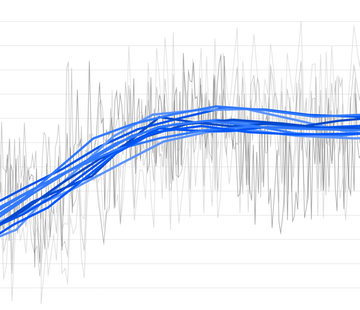
Datadog makes it easy to correlate, compare, and visualize metrics from your infrastructure and applications. Some metrics, however, are inherently so noisy that the graphs become unreadable (the dreaded spaghettification problem), and you lose the ability to extract essential information about trends and large-scale deviations. For cases like these, we provide several smoothing functions that help you identify trends in your metrics.


