Operations | Monitoring | ITSM | DevOps | Cloud
Latest News
Top 10 I&O Technologies for a successful 2020, 2021, 2022, 2023 & 2024
Each year there comes a time to look forward and think about next year and maybe even further. This can be a daunting task, especially in the fast-changing IT industry. Luckily, Gartner prepared a list of the top 10 technologies that will drive the future of Infrastructure and Operations up through 2024. This list might come in handy when you’re preparing your 2020 roadmap and beyond.
Top 7 Tomcat Metrics for Java Performance Monitoring
The Apache Tomcat software is an open-source implementation of the ava Servlet, JavaServer Pages (JSPs), Java Expression Language and Java WebSocket technologies. Tomcat is often used as a backend application server that connects to other web-facing servers like Apache and Microsoft IIS. Tomcat also includes its own native HTTP connector that allows it to be used as a standalone HTTP server.
Releasing Icinga Module for Jira
Our journey of Icinga integrations continues – we’re announcing the general availability of the Icinga Module for Jira v1.0 today! Jira is a ticketing system created by Atlassian and it’s one of the most popular ones of its kind. Jira is used by a very diverse audience: Developers, Managers, SREs, Systems Engineers and everyone else who needs to keep track of issues and projects.
Smart SLO Alerting With Wavefront
Back in the good old days of monolithic applications, most developers and application owners relied on tribal knowledge for what performance to expect. Although applications could be incredibly complex, the understanding of their inner workings usually resided within a relative few in the organization. Application performance was managed informally and measured casually. However, this model falls apart in a microservices world.
Monitor MapR performance with Datadog
MapR is an Apache Hadoop distribution that enables organizations to manage, analyze, and store all their data at scale. MapR handles a wide range of data types across infrastructures and locations by leveraging dataware, an abstraction layer in the enterprise software stack that separates data from any dependencies. We’re excited to announce that our new integration provides comprehensive visibility across all the moving parts of your MapR deployment.
Here's how Rojan, a leading MSP in Australia saves thousands on IT maintenance costs with OpManager
Rojan Australia Pty Ltd is a managed IT services provider that supports a wide assortment of customers and businesses, and provides services such as hosted Microsoft Exchange, Xen Citrix servers, rack space, internet links, and desktop support.
Daily Ignite Briefing: Highlights from Day #2
Our second day at Ignite was busy busy as usual! We’ve gotten into the full swing of things now with the demos, presentations, customer briefings and LEGO giveaways. As expected, sessions we attended today were Azure focused, with an emphasis on proper (and hybrid) monitoring, cloud migrations, and new tech like Azure Arc.
How to use CloudWatch to generate alerts from logs
There are more than a million people using Amazon Cloud products, so it follows that many customers are employing an AWS integration with their Opsgenie instance. One common use case involves creating Opsgenie alerts from CloudWatch Logs to help stay ahead of issues and prevent incidents. CloudWatch Logs is an AWS log storage and monitoring feature that collects logs from all systems, applications, and AWS services in a single place.
How to Stream Sensor Data with Grafana and InfluxDB
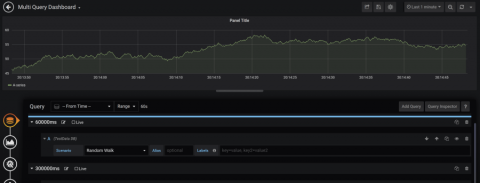
Building dashboards that show real-time streaming data and allow for interactive queries is challenging. At the recent InfluxDays conference in San Francisco, Ryan McKinley, Grafana Labs VP of Applications, discussed new approaches to integrate real-time data into Grafana dashboards. Prior to joining Grafana, McKinley worked at a renewable energy startup, Natel Energy, which builds hydropower turbines. There, he used Grafana and Influx to display an overview of how the systems were working.


