Operations | Monitoring | ITSM | DevOps | Cloud
Monitoring
The latest News and Information on Monitoring for Websites, Applications, APIs, Infrastructure, and other technologies.
Worth a Look: Public Grafana Dashboards
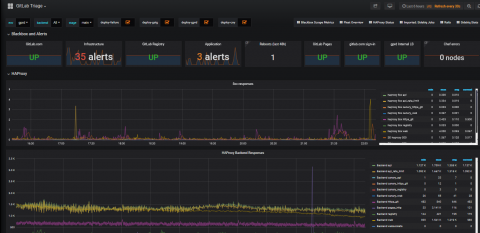
There are countless Grafana dashboards that will only ever be seen internally. But there are also a number of large organizations that have made their dashboards public for a variety of uses. These dashboards can be interesting to browse, giving you an insider’s peek into how real Grafana users set up their visualizations, with actual live data to boot. Perhaps some of them will inspire you to get to work on your own Grafana?
Introducing Snuba: Sentry's New Search Infrastructure
For most of 2018, we worked on an overhaul of our underlying event storage system. We’d like to introduce you to the result of this work — Snuba, the primary storage and query service for event data that powers Sentry in production. Backed by ClickHouse, an open source column-oriented database management system, Snuba is now used for search, graphs, issue detail pages, rule processing queries, and every feature mentioned in our push for greater visibility.
Stop Your Database From Hating You With This One Weird Trick
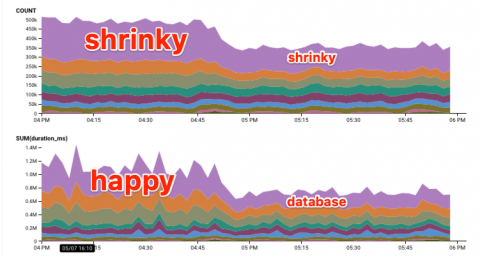
Let’s not bury the lede here: we use Observability-Driven Development at Honeycomb to identify and prevent DB load issues. Like every online service, we experience this familiar cycle. This is not a bad thing! It’s a normal thing. Databases are easy to start with and do an excellent job of holding important data.
11 Design Tools to Create Amazing Visual Content for Your Website
When you add high-quality images, infographics, videos, and other visual elements to your website, you don’t simply make it look more beautiful. You boost SEO, increase engagement, and make your content much more memorable. Great sites need amazing visual content.
What Your Website is Going to Lose if it is Not Secured
The very foundation of exchange between web & client-server protocol started with HTTP, where HTML form was the source of fetching resources - from documents to images. This extensible protocol was designed in the early '90s and has evolved over time. Cache or authentication is the main feature handled by HTTP which has never been compromised. Still, there are dangerous sites that are keen on corrupting the digital world.
How to use Mint, an awesome HTTP library for Elixir - Part 01
Mint is a shiny new Elixir package which allows you to make HTTP requests using the HTTP 1 and HTTP 2 protocols. It can transparently handle ALPN (Application Layer Protocol Negotiation), which essentially means that it can figure out if a server uses HTTP2 or HTTP1 on its own. It also comes with an optional dependency on a castore package which verifies the SSL certificates of the servers (that you connect to).
Building an AI-powered IT infrastructure
How We're Improving Error Grouping
Imagine that you are developing an application and there's an error in the code. When you release it to production, this error causes hundreds of thousands of crashes. In this case, a logging tool would list all the crashes but an error monitoring tool, like Rollbar, would attempt to group the crashes together. Now you would receive just one notification about an error that crashed hundreds of thousands of times instead of many notifications about different crashes.


