Operations | Monitoring | ITSM | DevOps | Cloud
The latest News and Information on Observabilty for complex systems and related technologies.
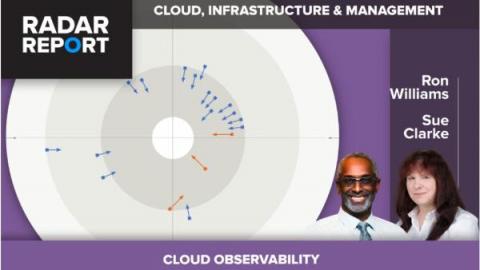
Broadcom Recognized as Outperformer in the 2023 GigaOm Radar Report for Cloud Observability
We are excited to share that the AIOps and Observability solution from Broadcom has earned a leader position for platform play and maturity in the GigaOm Radar Report for Cloud Observability, 2023. This report reviewed solutions from 20 vendors on 13 criteria, including across such areas as innovation, understanding of emerging trends, solution capabilities and features, and deployment models.
How FireHydrant Implemented Honeycomb to Streamline Their Migration to Kubernetes
Kubernetes is the gold standard for container orchestration at scale. While massive global companies like Google, Spotify, and Pinterest rely on Kubernetes to run their software in production, so do many small but mighty developer teams. (Full disclosure: Honeycomb joined the Kubernetes brigade last year, when we migrated some of our services.)
My Perspective on CloudFabrix Collaboration with the Cisco Full-Stack Observability Platform
Observability in Nutanix AHV environments and Hyper Converged Infrastructures (HCI)
Today, I’ll cover the benefits of monitoring and observability in Nutanix AHV environments and Hyper Converged Infrastructures (HCI) and how observability can help IT teams run cost-efficient, performant Nutanix deployments. Modern enterprises need infrastructures designed for resilience, cost-effectiveness, and application performance. Organizations are adopting hybrid multi-cloud strategies and looking to simplify and optimize on-premises and data center operations.
Multi-Cloud Made Simple: Announcing Kentik Observability Enhancements for AWS and Google Cloud
Limited visibility into network performance across multi-clouds frustrates even the best teams. That’s why we’re thrilled to announce enhanced AWS and GCP support for Kentik Cloud, enabling network, cloud, and infrastructure teams to rapidly troubleshoot and understand multi-cloud traffic.
DNS observability and troubleshooting for Kubernetes and containers with Calico
In Kubernetes, the Domain Name System (DNS) plays a crucial role in enabling service discovery for pods to locate and communicate with other services within the cluster. This function is essential for managing the dynamic nature of Kubernetes environments and ensuring that applications can operate seamlessly. For organizations migrating their workloads to Kubernetes, it’s also important to establish connectivity with services outside the cluster.
Shrink your IT budgets, not your observability needs
Are you getting value for every dollar spent on IT monitoring tools? Amidst the prevailing global economic turbulence, budgets are shrinking, and every dollar spent counts. However, Gartner forecasts a 5.1% growth in worldwide IT spending for 2023. Enterprises implement digital technologies to cope with layoffs and keep their systems up. The million-dollar question is: Is the monitoring output worth the cost of the monitoring solution?
Collecting Kubernetes Data Using OpenTelemetry
Running a Kubernetes cluster isn’t easy. With all the benefits come complexities and unknowns. In order to truly understand your Kubernetes cluster and all the resources running inside, you need access to the treasure trove of telemetry that Kubernetes provides. With the right tools, you can get access to all the events, logs, and metrics of all the nodes, pods, containers, etc. running in your cluster. So which tool should you choose?


