Operations | Monitoring | ITSM | DevOps | Cloud
The latest News and Information on Observabilty for complex systems and related technologies.
Choosing an Observability Pipeline
An observability pipeline is a tool or process that centralizes data ingestion, transformation, correlation, and routing across a business. Production engineers across ITOps, Development, and Security teams use them to more efficiently and cost-effectively transform their telemetry data to drive critical decisions. Businesses of all sizes can enjoy several benefits and gain a significant competitive advantage by implementing an observability pipeline.
Ensure your Kubernetes workloads are achieving their full potential with Splunk Observability
How to use Cribl Stream and ChaosSearch for Next-Gen Observability
Kentik takes network observability to KubeCon 2022
If you’re an engineer trying to fix real problems with your apps, looking at just one small part of the picture isn’t going to cut it. This is why Kentik is so focused on helping you understand what’s going on beyond single k8s instances, and it’s a big part of what network observability is all about. This was Kentik’s message at Kubecon 2022, which was a memorable event for us.
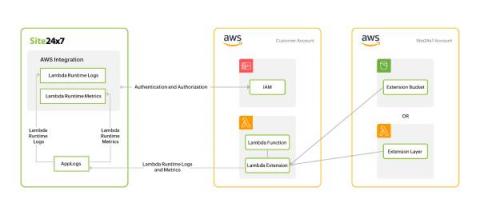
Achieve observability with Site24x7 and AWS Lambda Telemetry API integration
The Lambda Telemetry API empowers users to integrate monitoring and observability tools like Site24x7 with their Lambda functions. Site24x7 is an AWS-reviewed Lambda Service Ready Program Partner and is announced as a launch partner in AWS Lambda Telemetry API feature release. Customers, AWS partners, and the serverless community can use the Lambda Telemetry API to receive telemetry streams from the Lambda service, including function, extension logs, and metrics coming from the Lambda platform.
Feature Focus: October 2022
There are a ton of leaves in my yard, and I’m slowly coming out of a weeklong sugar coma. That can only mean October has come and gone. Let’s take a peek at what new and noteworthy changes Honeycomb has made since we last checked in.
How many data sources do you monitor? Find out how you measure up in our Observability Survey
Here at Grafana Labs, we’re deeply committed to our “big tent” philosophy — the idea that disparate data sources, from different software providers, in different industries, built for completely different use cases, can come together in one composable observability platform. As part of that commitment, we’ve set out to hear from our community about their observability practice and what they hope to see in this space in the future.


